LISEM Classic
LISEM
Study Site Preparation
In order to work with the LISEM Hazard model, it is usually beneficial to start with the selection of your study site. Consequently, the active processes can be determined, and required data listed.
A general data requirement set is provided below:
| Process | Required Data | Quality Requirements |
|---|---|---|
| Hydrology | Elevation Model | High |
| Land cover | Low | |
| Soil Types | Medium | |
| rainfall/snow melt | Medium | |
| GroundWater | Hydrology + Soil Depth | Medium |
| Flooding | Hydrology + no additional needs | - |
| Slope Stability | Hydrology+Groundwater+ Cohesion, density and Internal Friction angle | High |
| Slope Failure | Hydrology + Groundwater + Slope Stability + no additional needs | - |
| Simple water flow | Elevation + Manning’s N + initial water volume | - |
| Simple Landslide/debris flow runout | Initial Volume, elevation, Mannings N and cohesion, density and internal friction angle | High |
| Complex multi-process simulation | All of the above | - |
In order to get started with collecting the data, first a study site must be defined. To do this, the elevation must be gathered first. When hydrology is considered, it is often highly recommended to model a specific watershed. A watershed is a collection of points that drain into a common outflow points (the drainage area of a river/stream).
Let us get such a study site from raw elevation data.
The example below is LIDAR elevation data for a small (South-Eastern) part of the carribean island Dominica, near Grande-Bay.
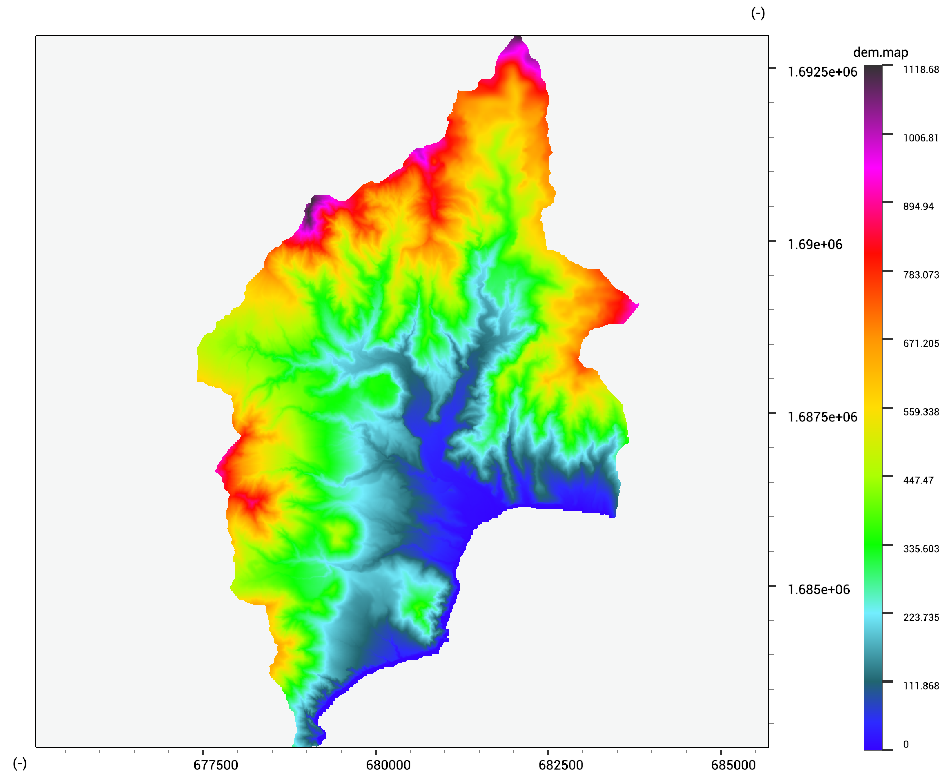
NOTE: Elevation data can often be subject to inaccuracies. Globally available free datasets such as SRTM 1-arcsecond (approx. 30 meters) void filled can be obtained from USGS earthexplorer. Alternatively, a 12.5 meter resolution dataset is available from the ALOS palsor instrument. It is important to consider the quality of the data before modelling. Visualizing a hillshade, slope or curvature highlights strange artifacts in elevation. For flow processes, it is slope directions that really matter for modelling. Because of this, errors are most noticable in flat terrain. LISEM offers some edge-preserving filters that might be used to selectively filter flat terrain. See also BilateralFilter, AnisotropicDiffusionFilter and KawaraFilter. In general, good advice is to compare alos palsar and srtm data before committing to either!
You can download the LIDAR elevation data , SRTM elevation data, or Alos palsare elevation data for this area.
When finding a watershed, the next step to take is to analyze drainage directions. You can calculate the drainange network using the following code:
ldd.tif = DrainageNetwork(dem.tif);
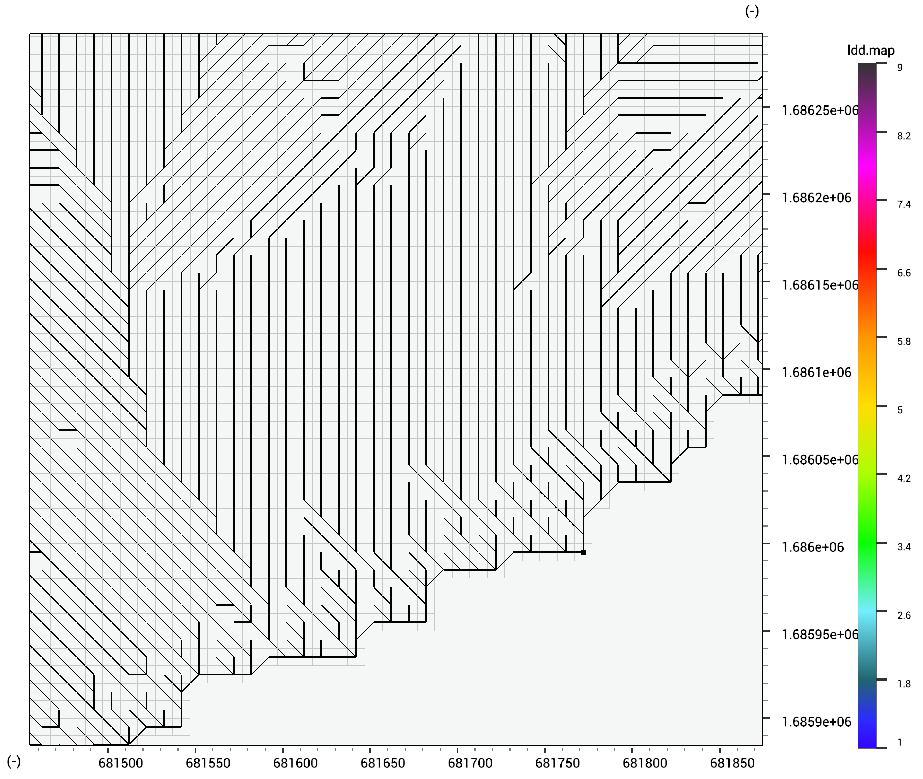
The resulting network might not be ideal due to several reasons. First, the default function merges all catchments, independent of size. In the case of a carribean island, it is usefull to have seperate catchments that drain into the ocean. The additional arguments for the DrainageNetwork function allow you to set a critical core size, core area, core volume and required precipitaion. Usually it is best to try some different magnitudes of numbers untill a desired network is created. Finally, the last options allows you to specify if missing-value cells will enforce the end of a catchment.
ldd.tif = DrainageNetwork(dem.tif,1e6,1e6,1e6,1e6, true)
All depressions that are not considered an induvidual catchment are typically errors in elevation data, and might be removed using the following code:
dem_fix.tif = DrainageNetworkDEM(dem.tif,1e6,1e6,1e6,1e6,true);
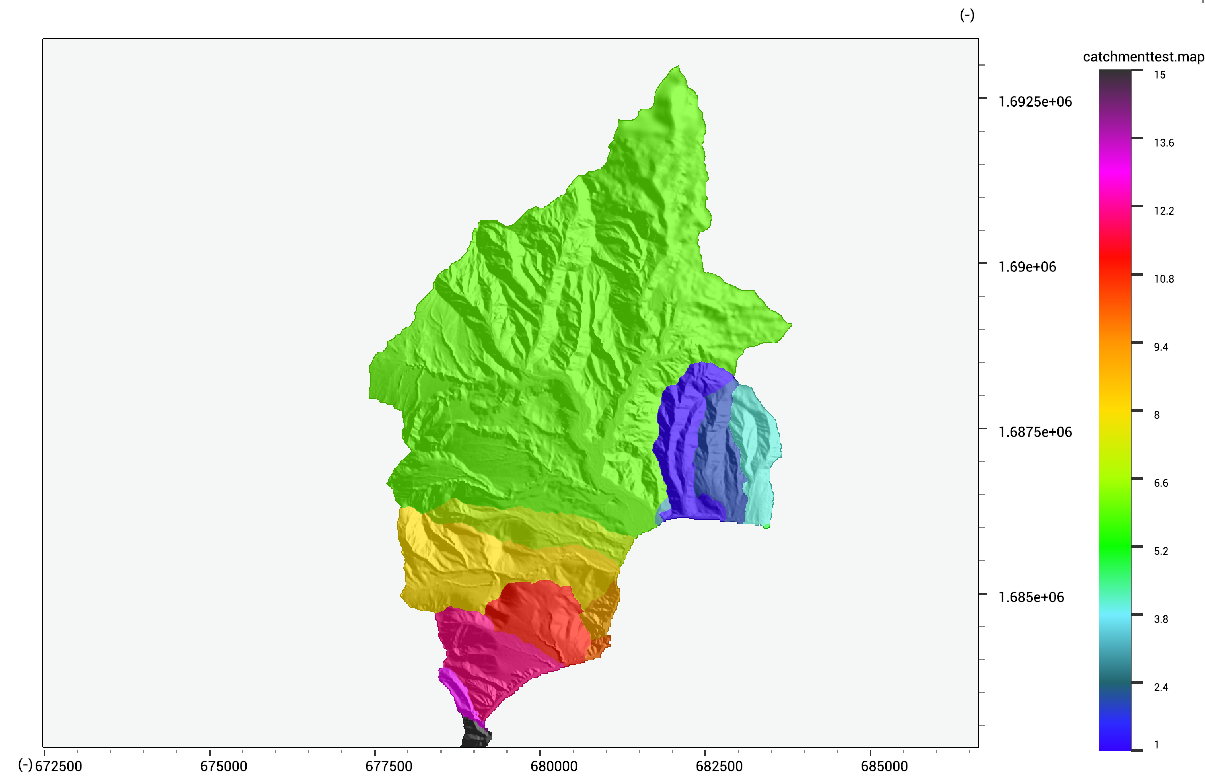
With our ldd in hand, we can define the catchments:
pit.tif = Pit(ldd.tif);
catchments.tif = Catchments(ldd.tif,pit.tif);
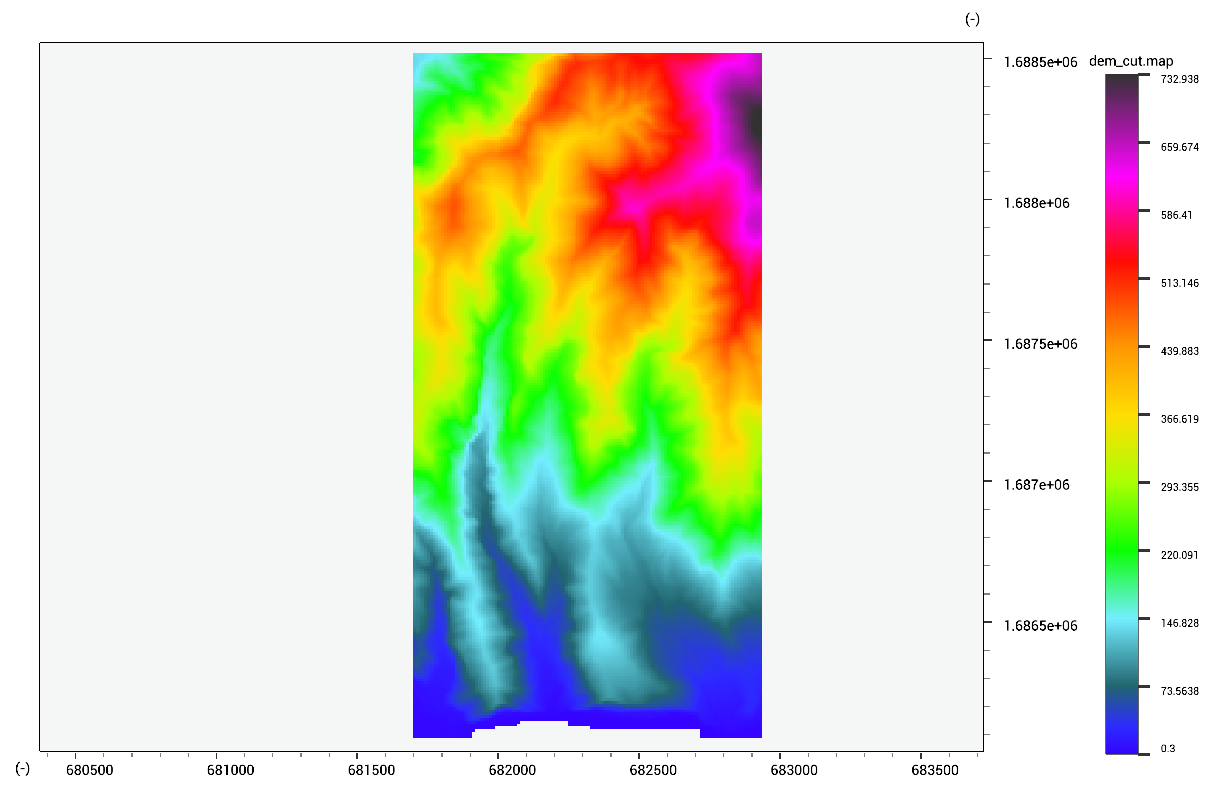
At this stage, it is good practice to cut out the catchment dataset, and define a new elevation model and drainange network. For example, if your catchment has id 56:
Region r = ClassExtent(catchments.tif, 56);
dem_cut.tif = RasterCut(dem.tif,r);